
 Get it for my Mac (947 MB)
 HitPaw Watermark Remover
2.4.7

- Version
- 9.4.260713.a97520e5
- Developer
- Hex-Rays SA
- Interface in
- English
- Licence on file
- Included
- macOS it runs on
- macOS 10.15 or later
- Chip support
- Apple Silicon, Intel 64-bit
In the edit
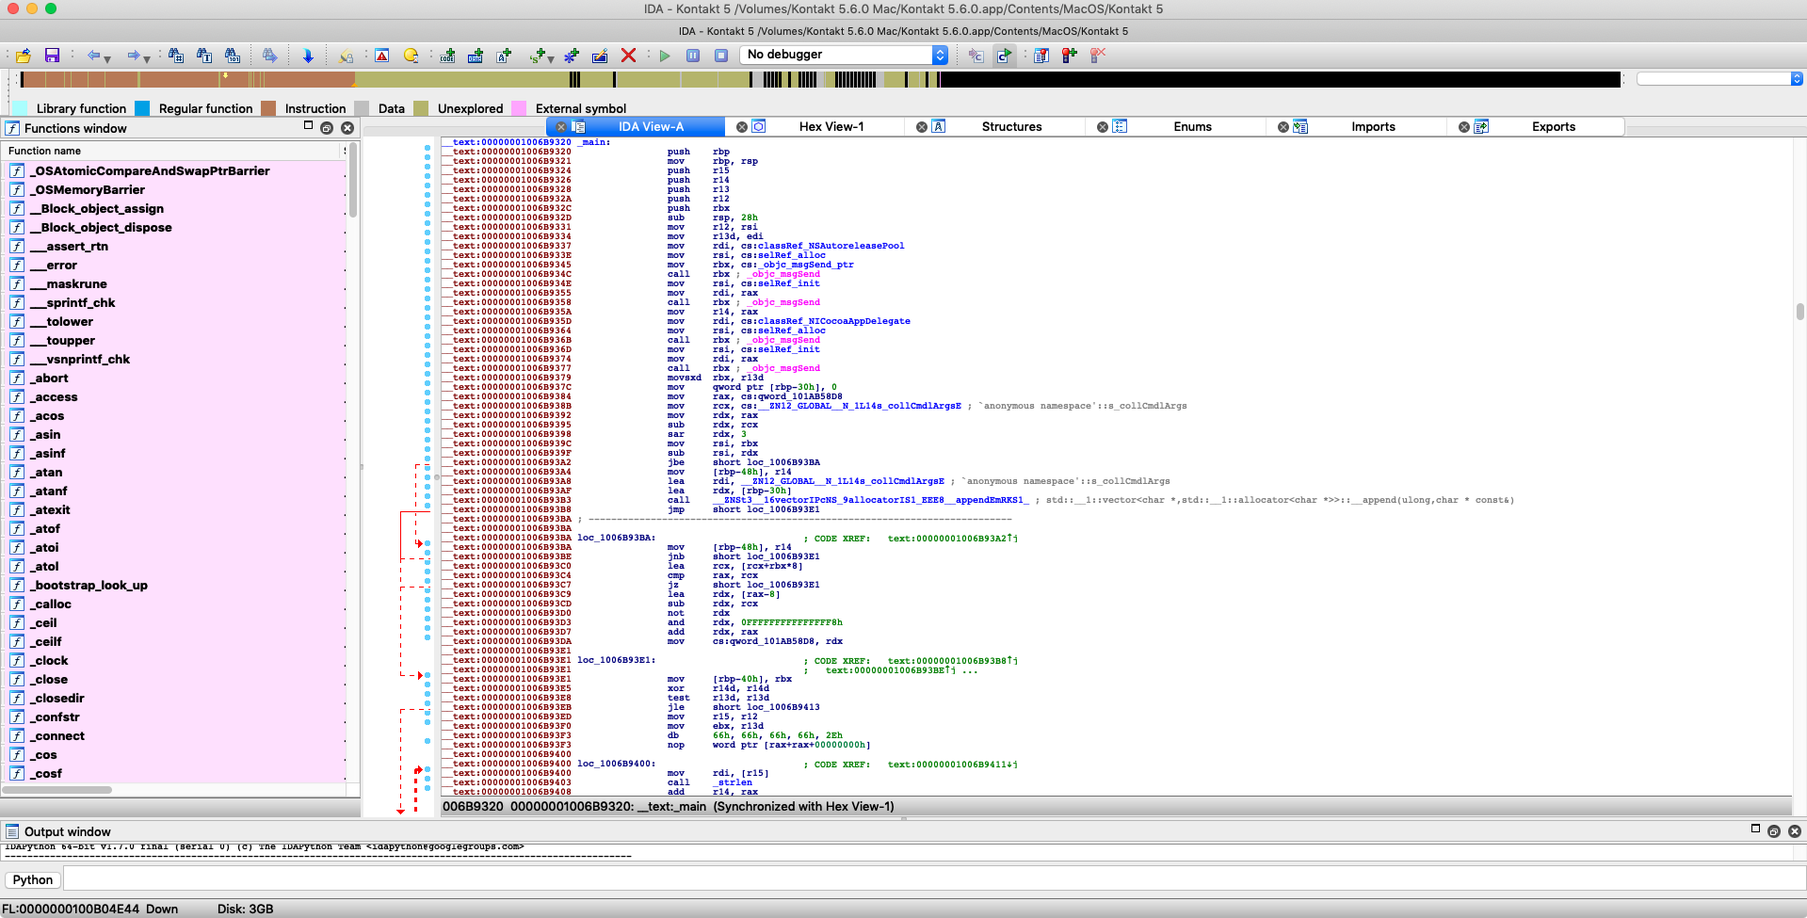
You know that feeling when you open a binary and it looks like someone scrambled the pages of a book before handing it to you. IDA Pro is the tool that lets you piece it back together — a disassembler, decompiler, and debugger all in one window, built for the kind of analysis that makes sense of unfamiliar code.
What stands out in version 9.4
- New Dyld Shared Cache infrastructure — handles modern macOS binaries with the shared cache layout Apple actually ships.
- Swift analysis improvements — better demangling and type recovery for Swift-compiled code, which is becoming more common in both apps and malware.
- Pathfinder — a new feature that helps trace execution paths through complex control flow.
- Hexagon QDSP6 processor module — opens up Qualcomm DSP firmware for inspection.
- Qualcomm MBN boot-image loader — useful if you work with mobile firmware or embedded security.
Rename variables and add comments as you analyze
Interactive analysis is the core: you can rename variables, add comments, and define structures and arrays as you go, and IDA remembers everything. The built-in data debugger lets you step through live processes, while FLIRT recognises standard library calls so you don't waste time identifying memcpy for the hundredth time. If you need to script repetitive tasks, IDC is there, and the modular architecture means you can plug in custom processors or loaders. It runs on both Intel and Apple Silicon Macs, back to macOS 10.15.
Start with a familiar binary you compiled yourself
If this is your first time with IDA Pro, start with a small, familiar binary — something you know the source of, like a simple command-line tool you compiled yourself. Load it and let IDA perform its initial analysis. Watch how it identifies functions, builds cross-references, and applies FLIRT signatures to known library calls. The first run sets your baseline for how the tool presents information.
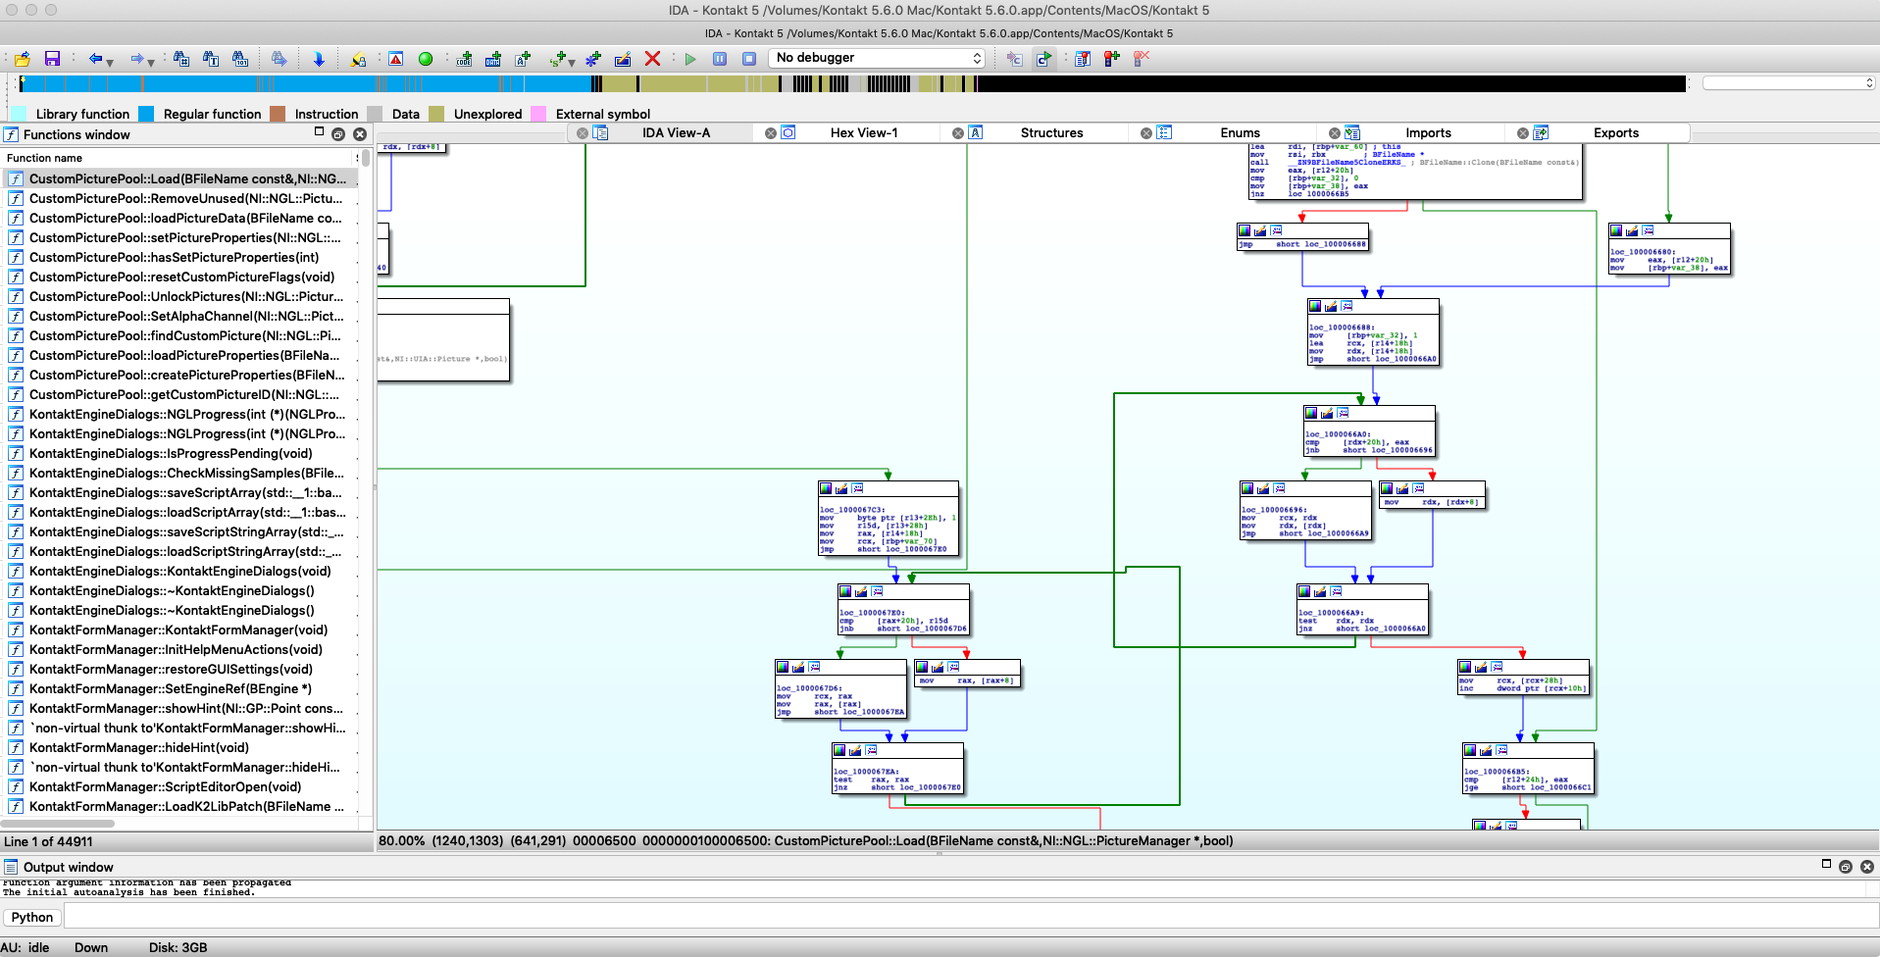
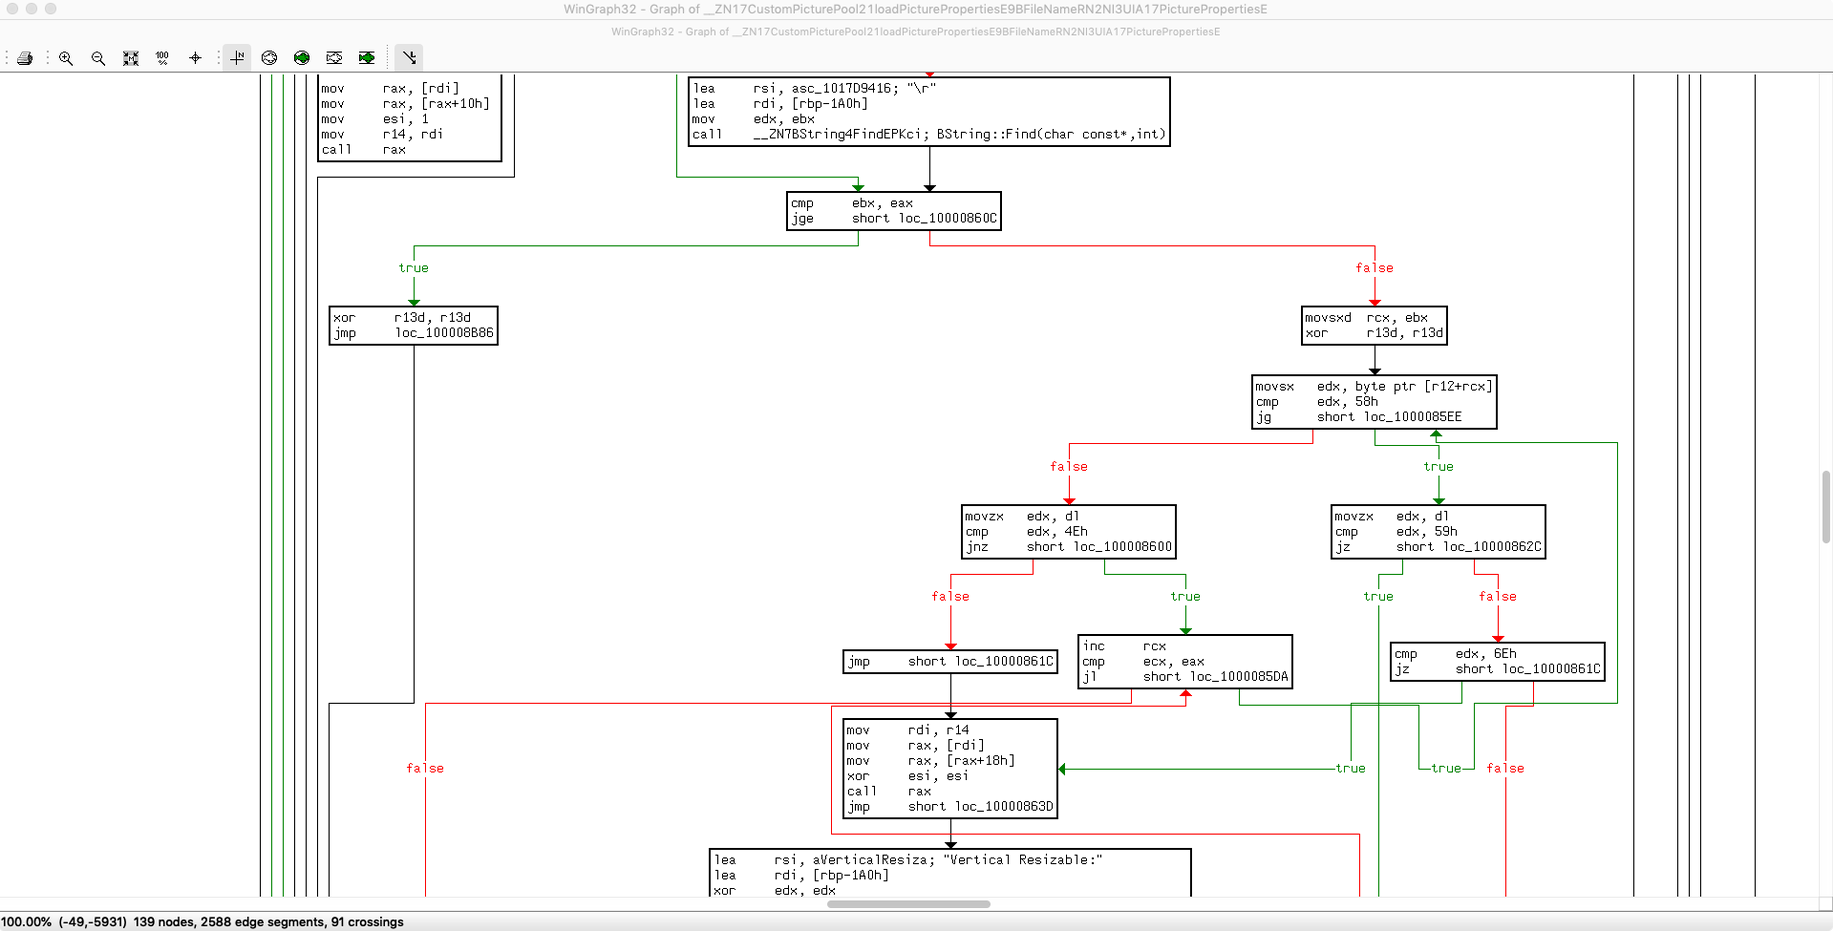
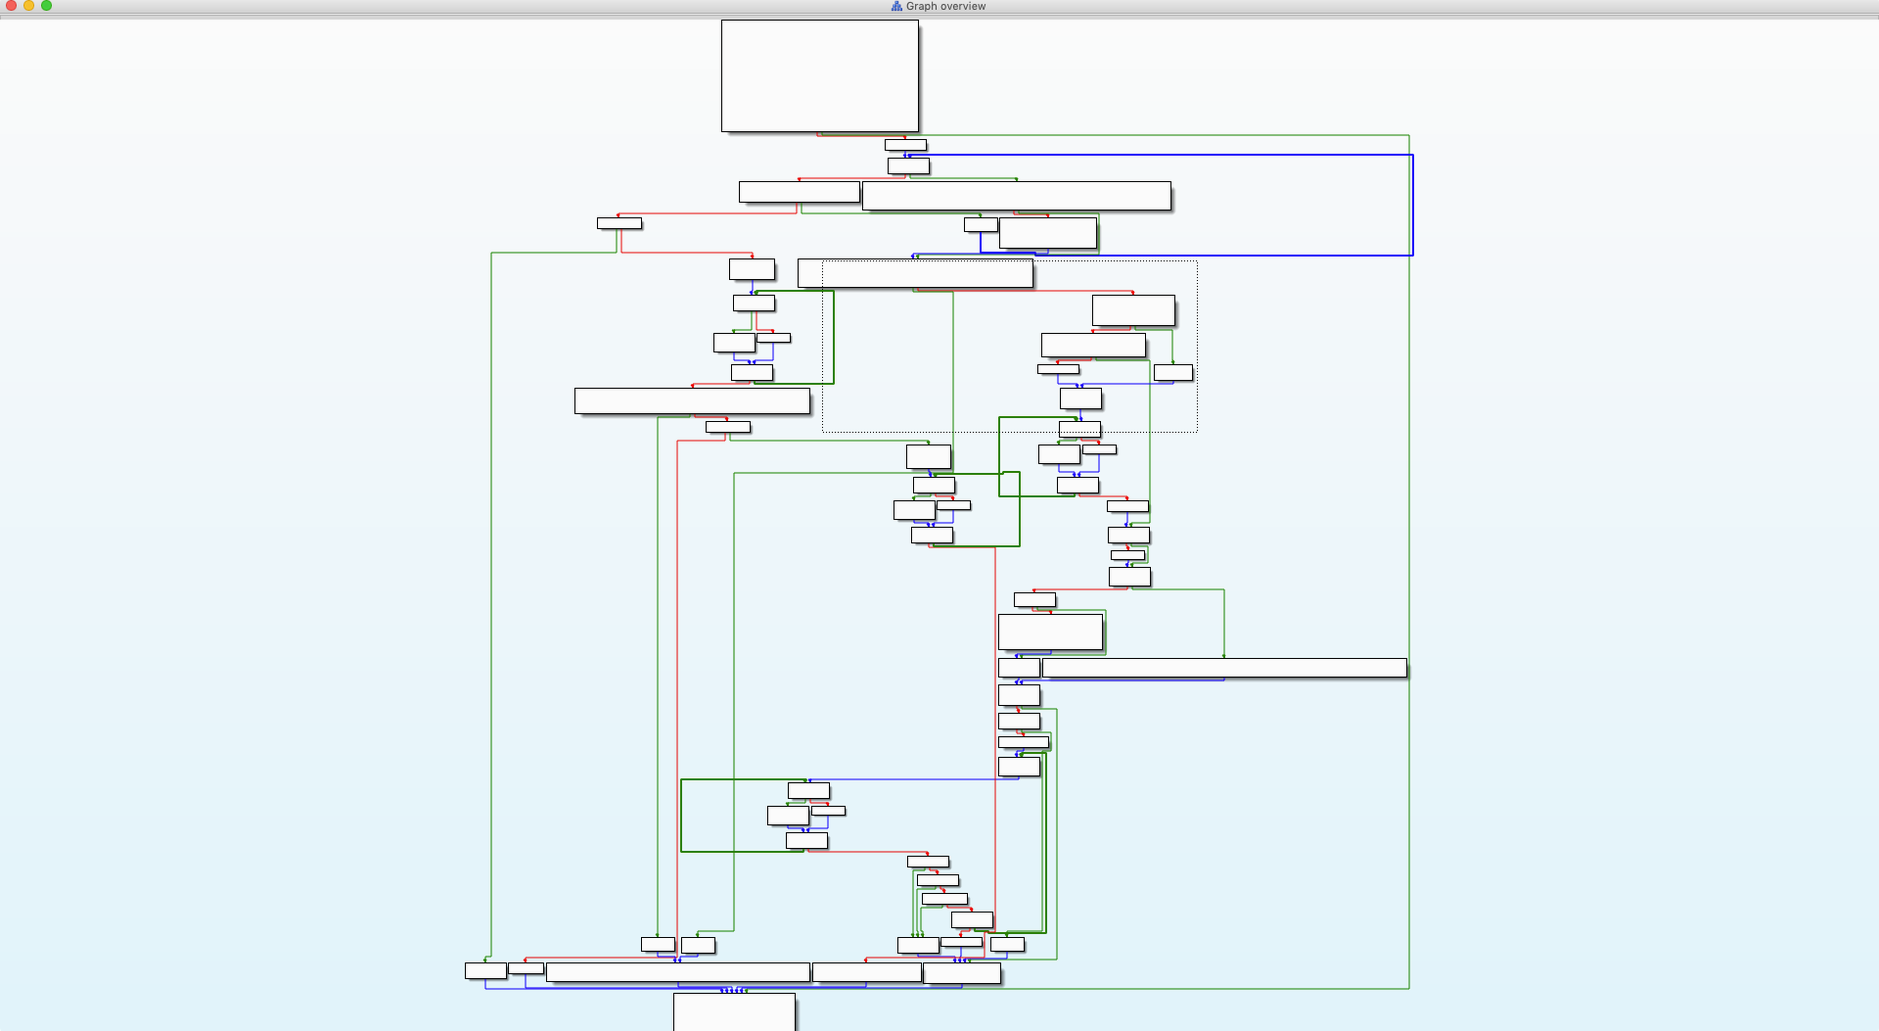
Spend a few minutes in the navigation views. The graph view is particularly useful for following control flow at a glance, and switching between it and the text view gives you two ways to read the same code. Rename a few local variables as you go — even in a test file, this builds the habit of annotating as you analyse.
Define a function signature once and IDA carries it everywhere
- Function type and parameter handling — when you encounter a call to an unknown function, you can define its signature once and IDA carries it through the rest of the database. This saves re-typing in every location the function is called.
- Array and structure support — defining a memory region as an array or structure lets IDA display offsets and member names inline, turning a block of raw hex into something you can read.
- Cross-references — right-click any operand and jump to where it is written or read. It is a quick way to trace data flow without scrolling through the whole disassembly.
- The IDC console — you can evaluate expressions and call IDA functions directly from the command line. Useful for testing a small script idea before writing it into a file.
Let Dyld Shared Cache resolve system calls in a Mach-O sample
Say you have a Mach-O sample that was flagged by a sandbox. You drop it into IDA Pro on a Mac, let the new Dyld Shared Cache infrastructure resolve the system calls, and immediately see that the binary imports mach_vm_protect and ptrace in a way that suggests memory patching. The Swift analysis improvements help if the sample was written in Swift — the demangled symbols show class names and method signatures that hint at its real purpose. You set a breakpoint in the data debugger, run the sample in a controlled environment, and watch where it writes. The Pathfinder feature helps you trace which branch it actually takes past the anti-analysis checks. By the end of the session, you have renamed the key functions and added comments that explain the infection routine, ready for the report.
New this release
- New Dyld Shared Cache infrastructure for modern macOS binaries
- Swift analysis improvements for better demangling and type recovery
- Pathfinder for tracing execution paths through complex control flow
- New Hexagon QDSP6 processor module for Qualcomm DSP firmware
- Qualcomm MBN boot-image loader for mobile firmware analysis
Mac it needs
- macOS 10.15 or later
- Intel or Apple Silicon
- English interface
Questions I actually get
Can IDA Pro debug live processes on macOS?
Yes, IDA includes a built-in data debugger that lets you step through live processes and inspect memory, registers, and variables during analysis.
Installing on a Mac
- Install the app from the provided package.
- Follow the included installation instructions.
- Use the included activation instructions if needed.
Notes from photographers
Sign in or create your account to leave a comment.
No notes from photographers yet. If you have used this on a real folder, say which camera and which Mac.
Similar apps
Next to it in Mac Apps
All Mac Apps picks
HitPaw Watermark Remover
2.4.7
 HitPaw Video Converter
4.5.0
 HitPaw Univd
4.7.0
 HitPaw Edimakor
2.6.0
 iReal Pro
2026.3.2
 iZotope Ozone
12.1.0
 Guitar Rig
7.0.2
 Guitar Pro
8.1.5
